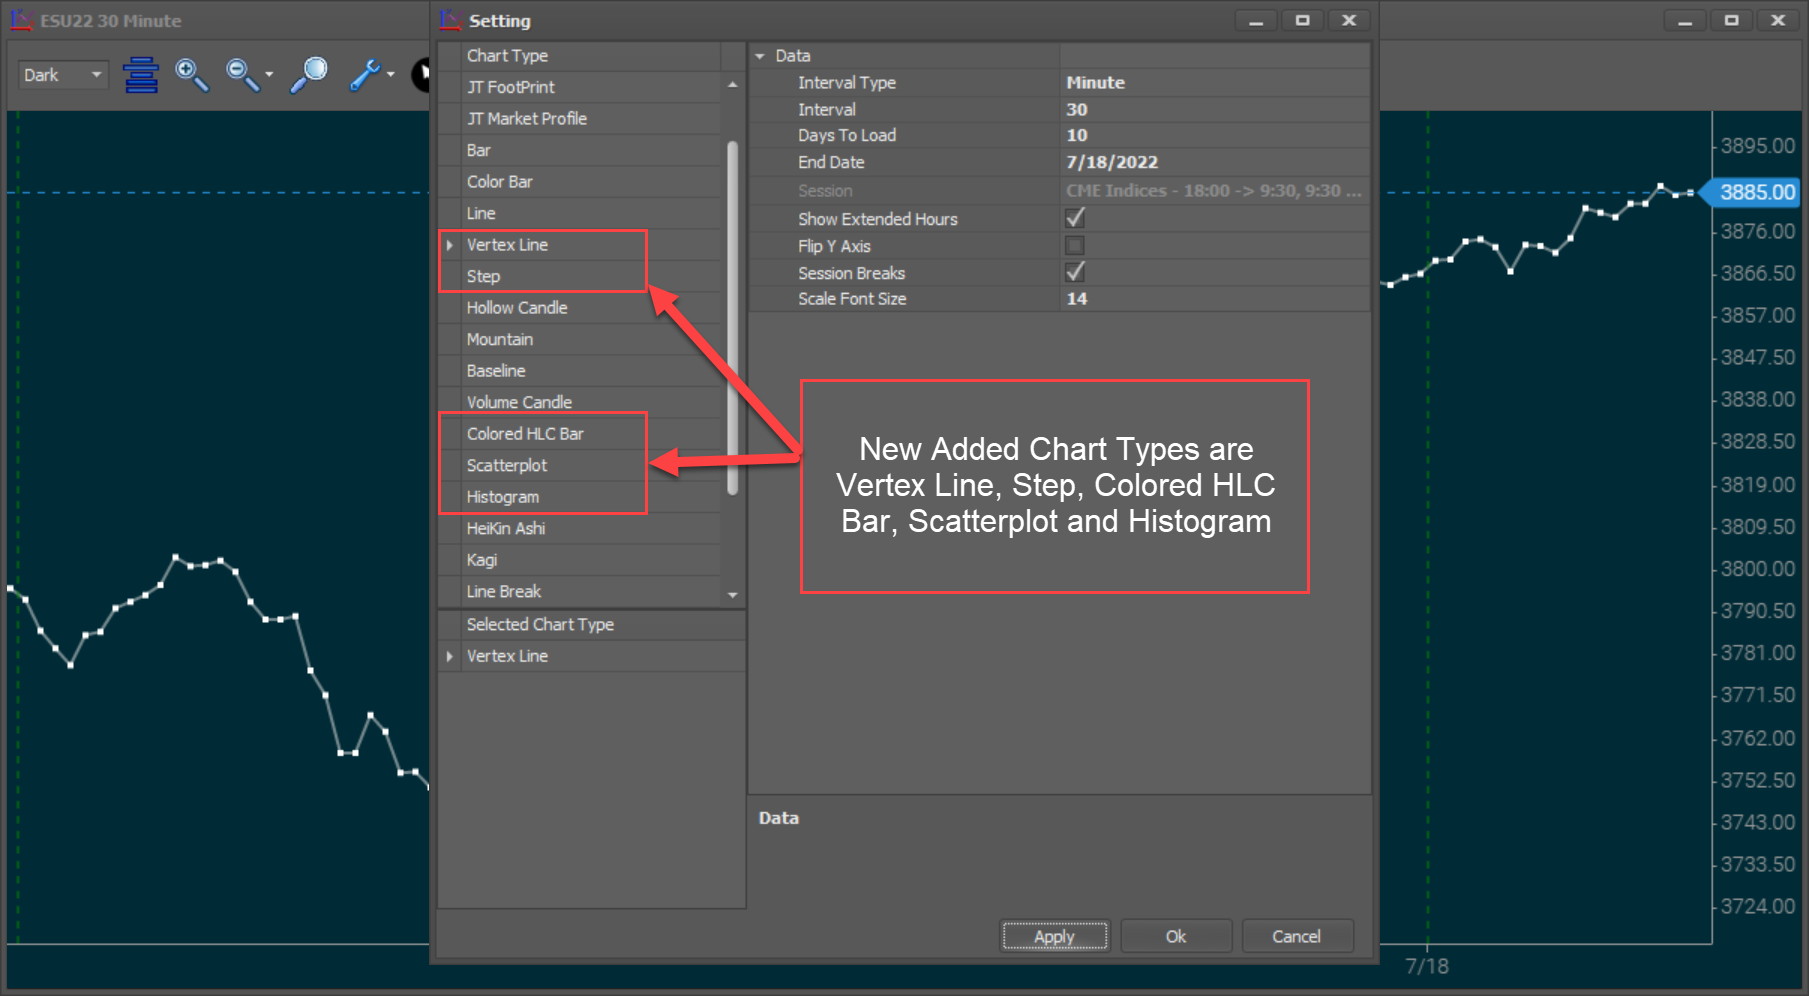
We have added following chart types to daytradr.
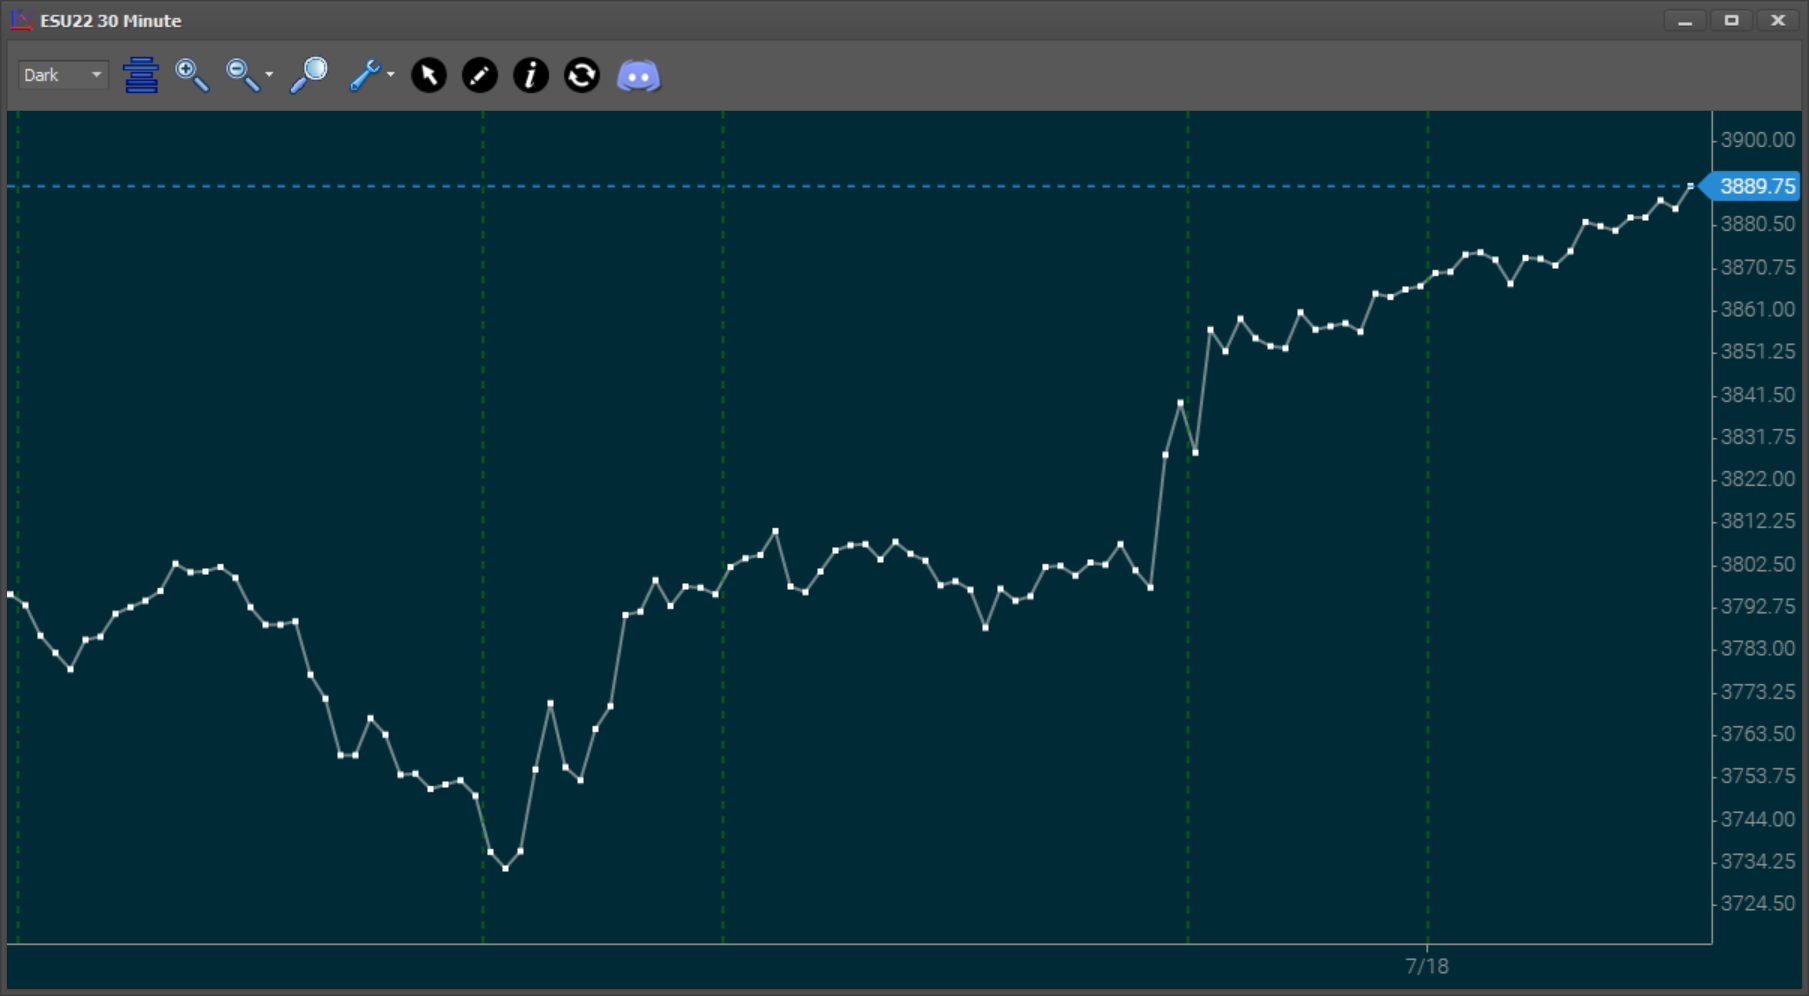
•Vertex Line
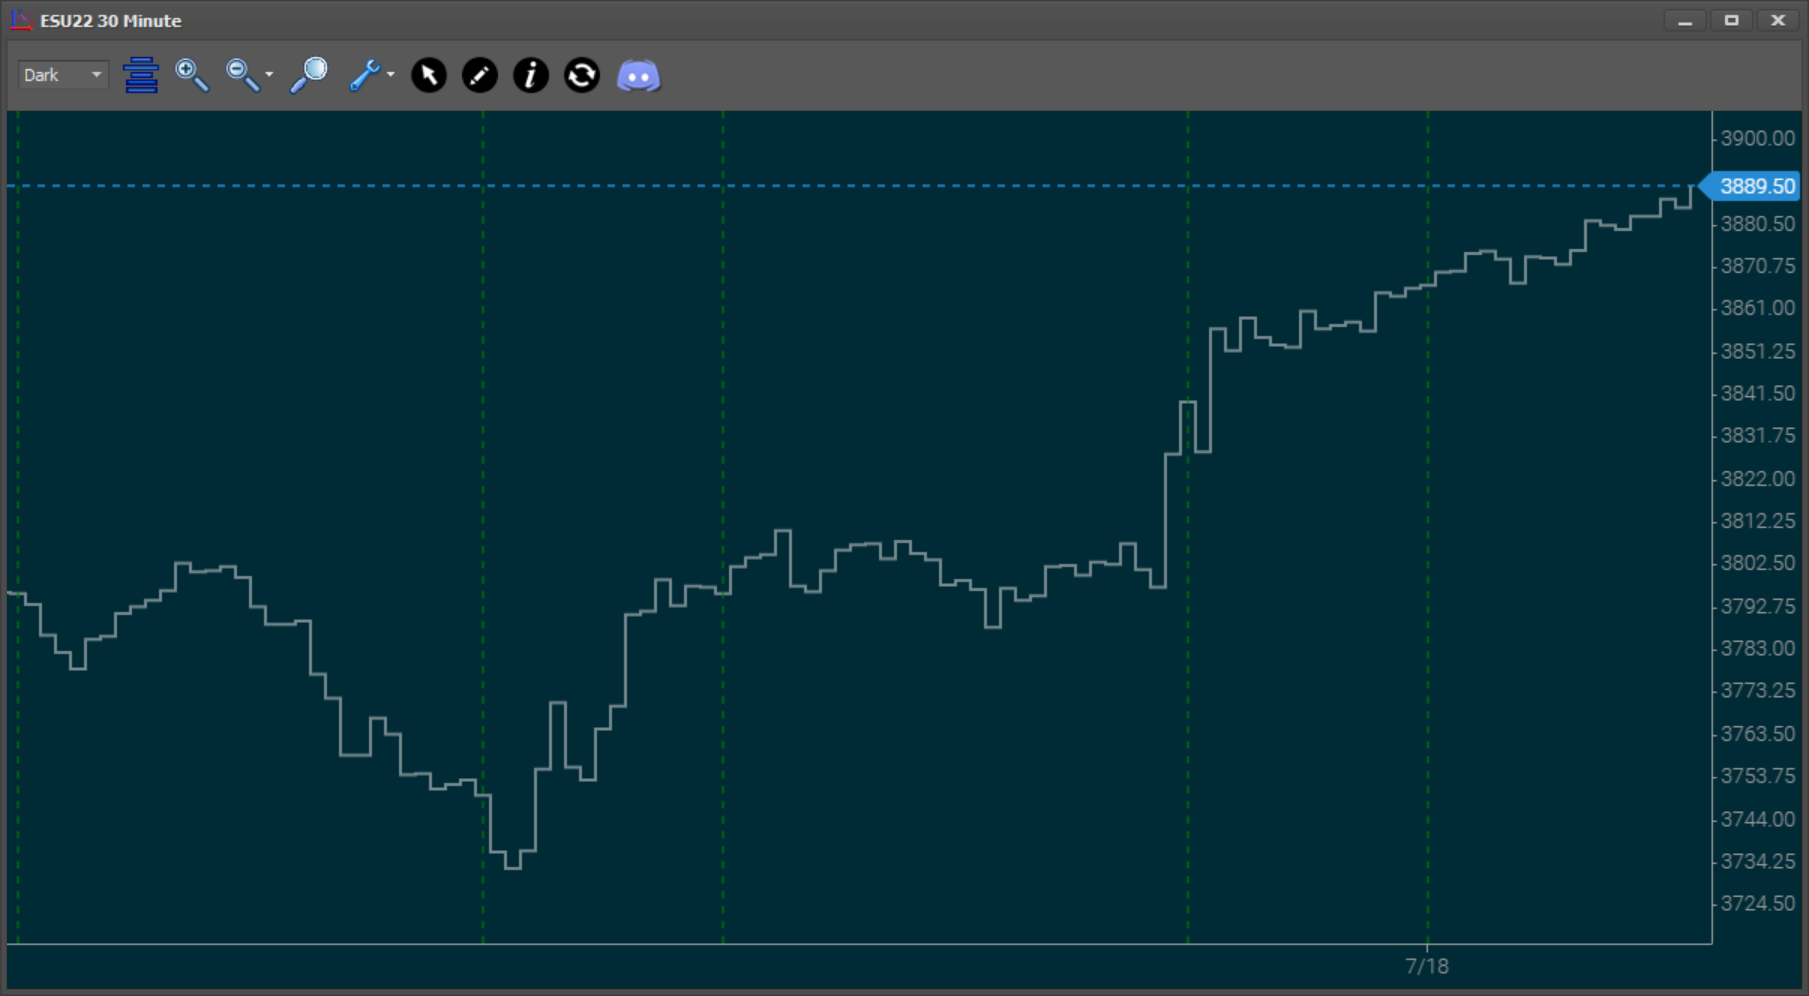
•Step
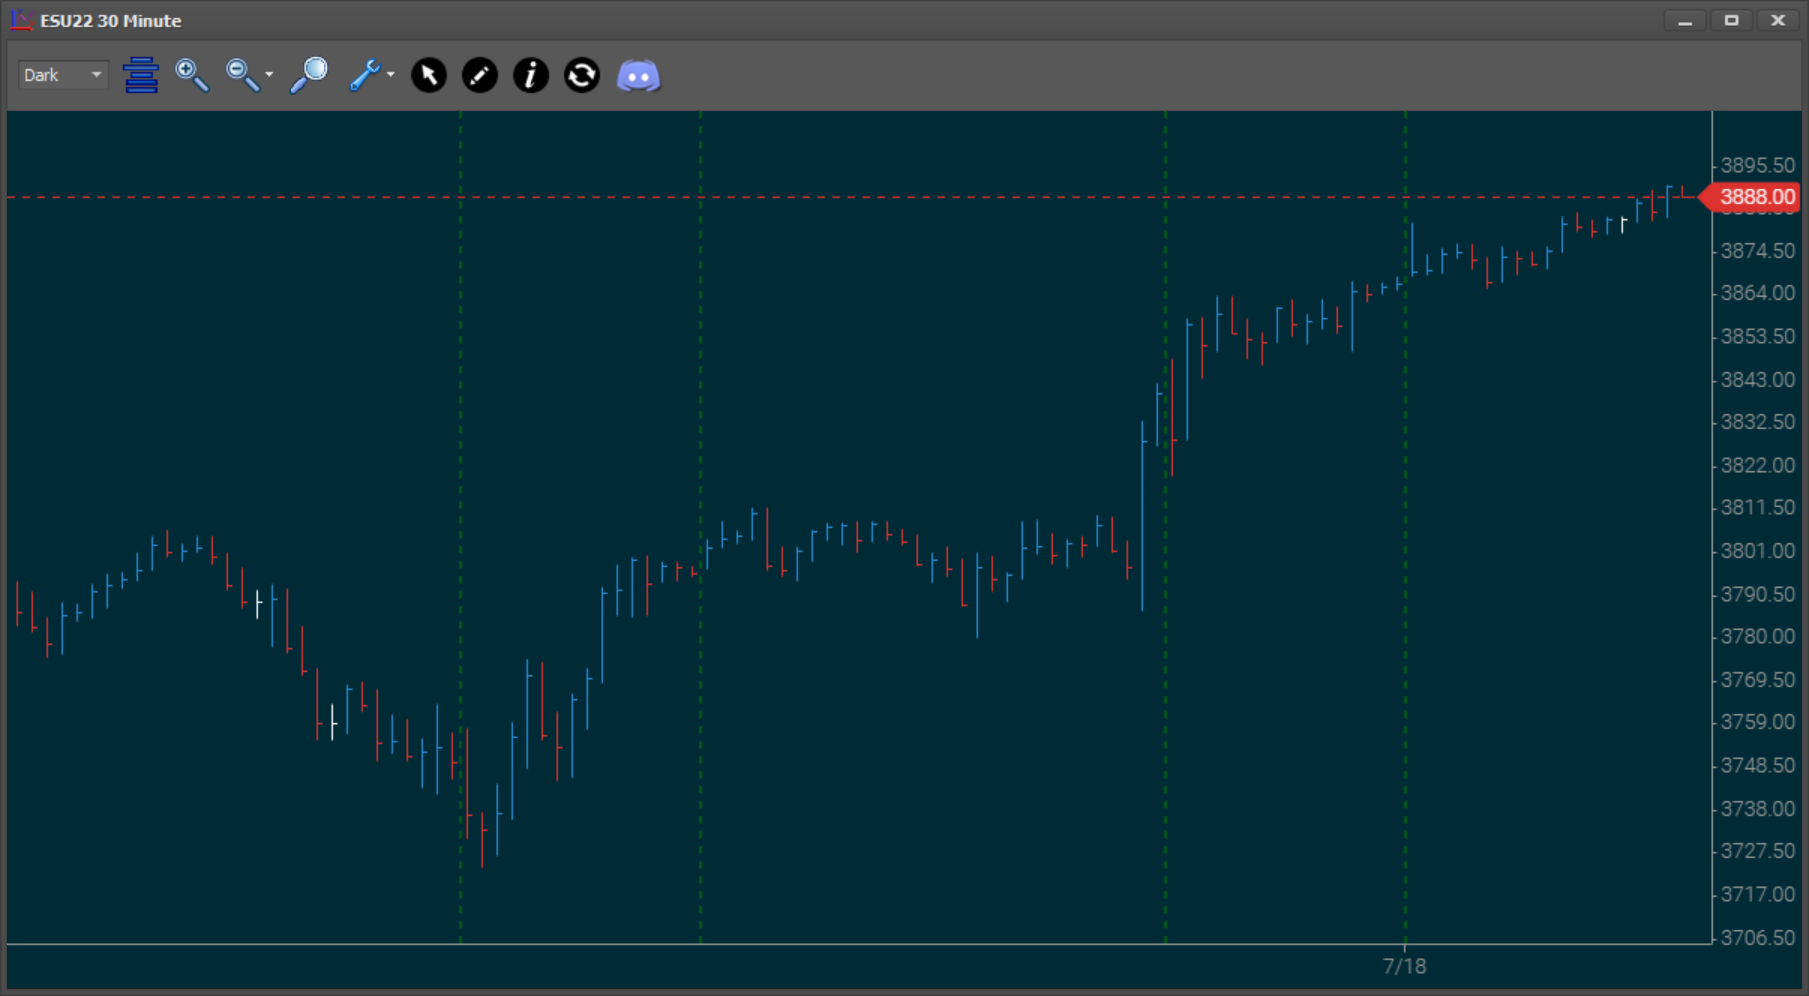
•Colored HLC bar
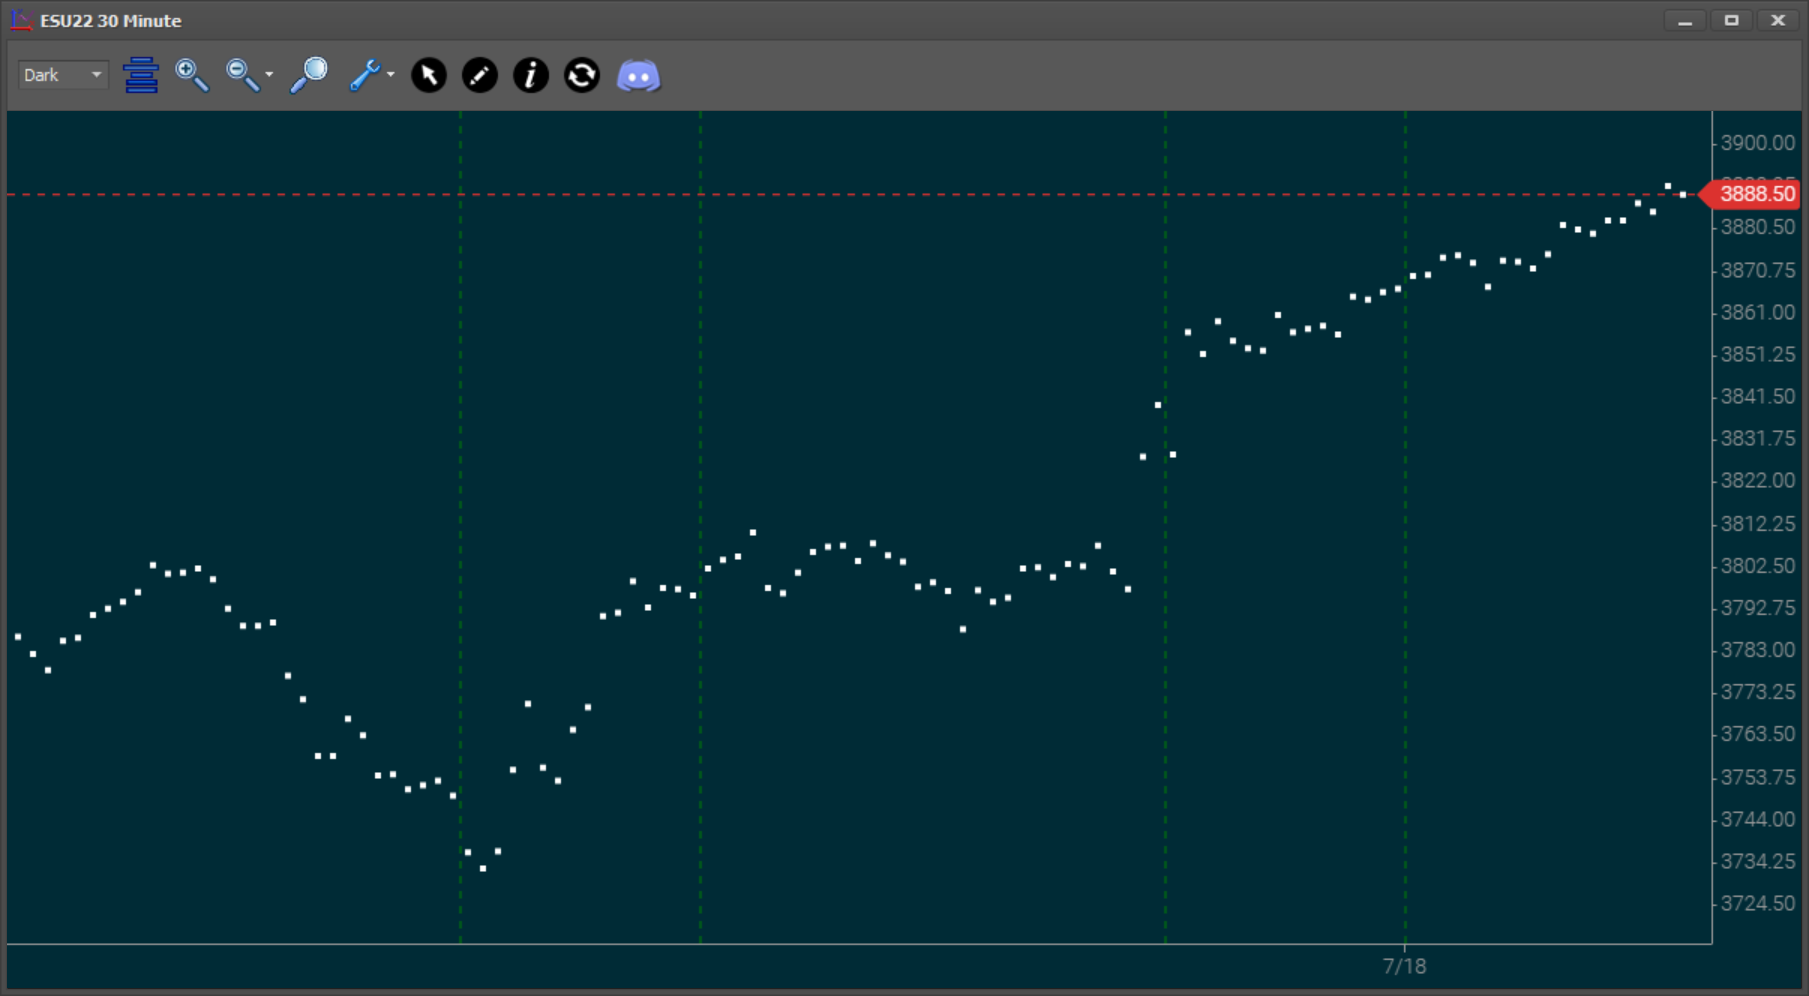
•Scatterplot
•Histogram
Here's a video where you can learn about the new chart types:

New Chart Types
To open a chart type, go to the main platform menu
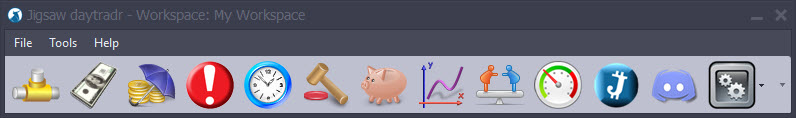
Click  to open the Chart window. The Chart and Symbol Search will then open in a separate window.
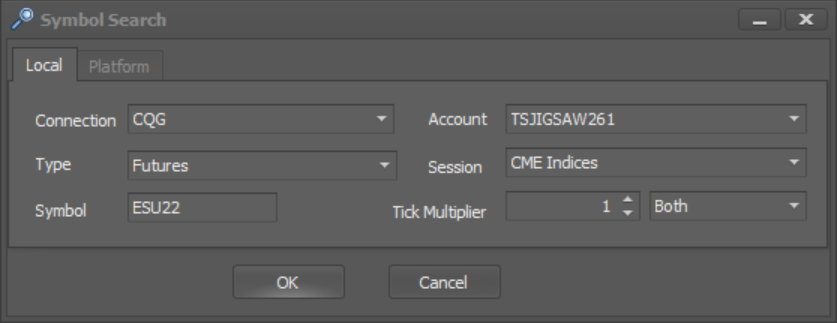
Once the instrument has been selected, you will be able to select a new chart type.
Vertex Line Chart is shown below.
Step Chart is shown below.
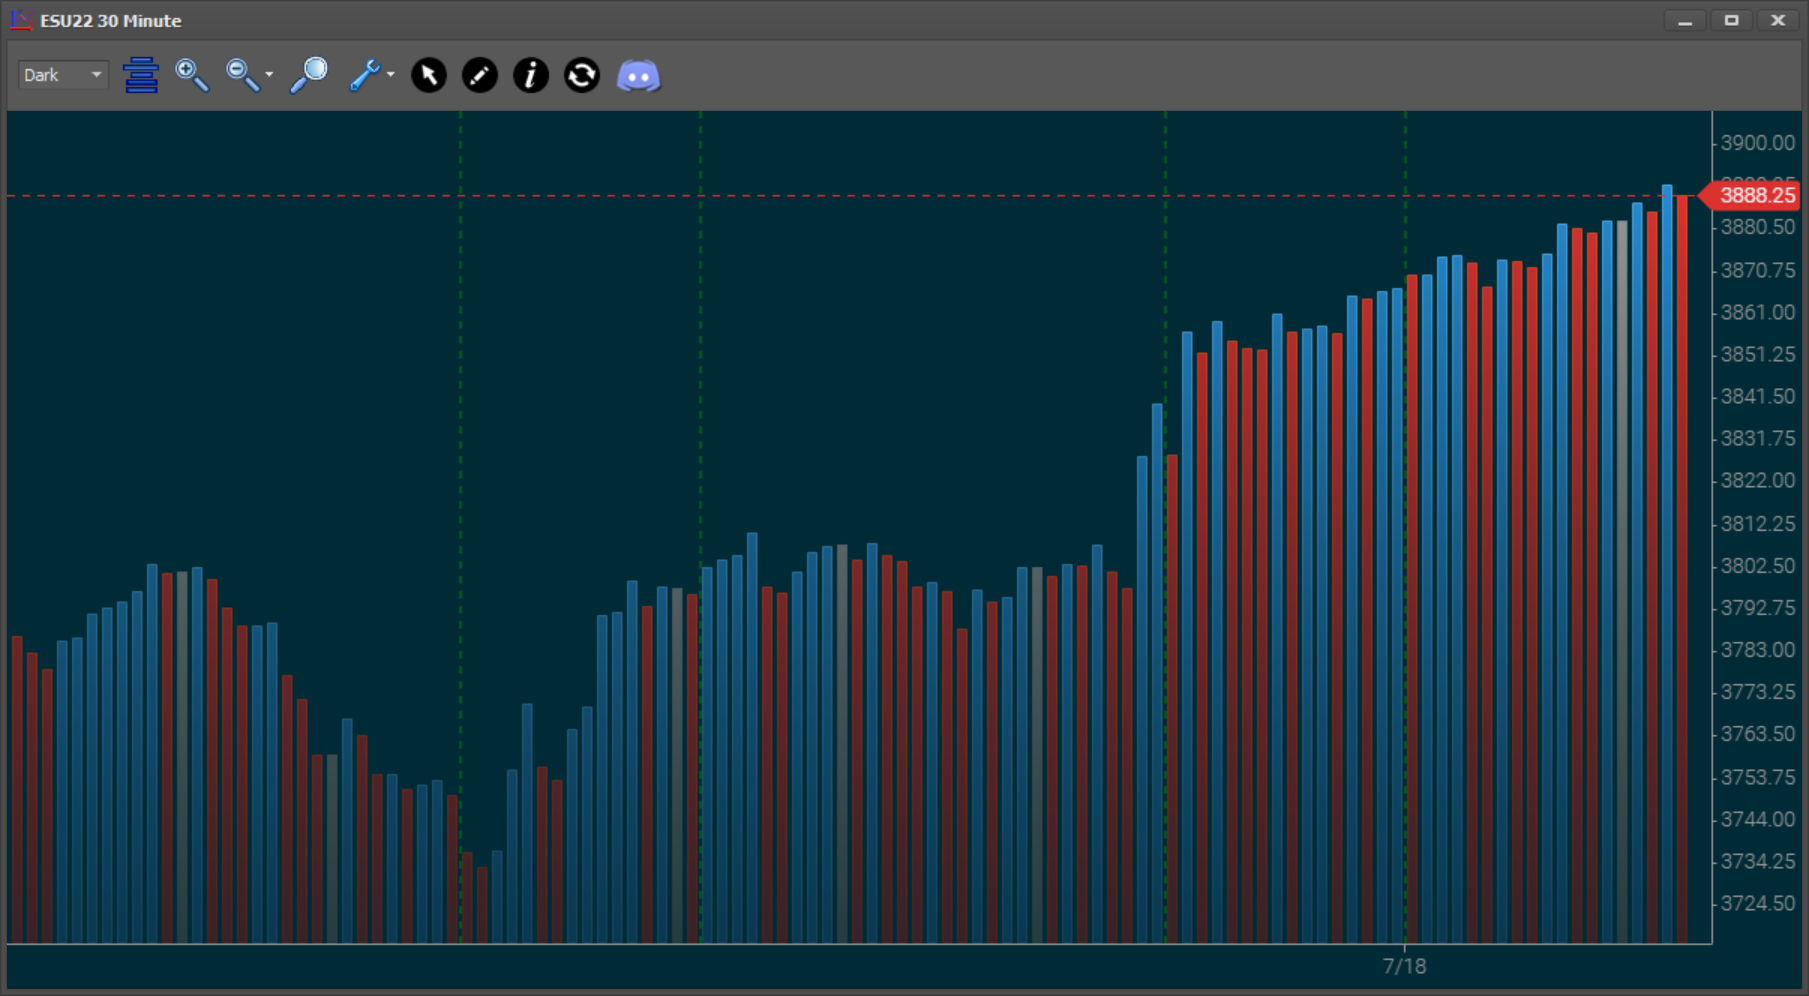
Colored HLC Bar Chart is shown below.
Scatterplot Chart is shown below.
Histogram Chart is shown below.