Market Profile or TPO Charts (Time Price Opportunity) are in vogue at the moment and do provide a great high level view of the prior sessions activities in a very easy to absorb manner.
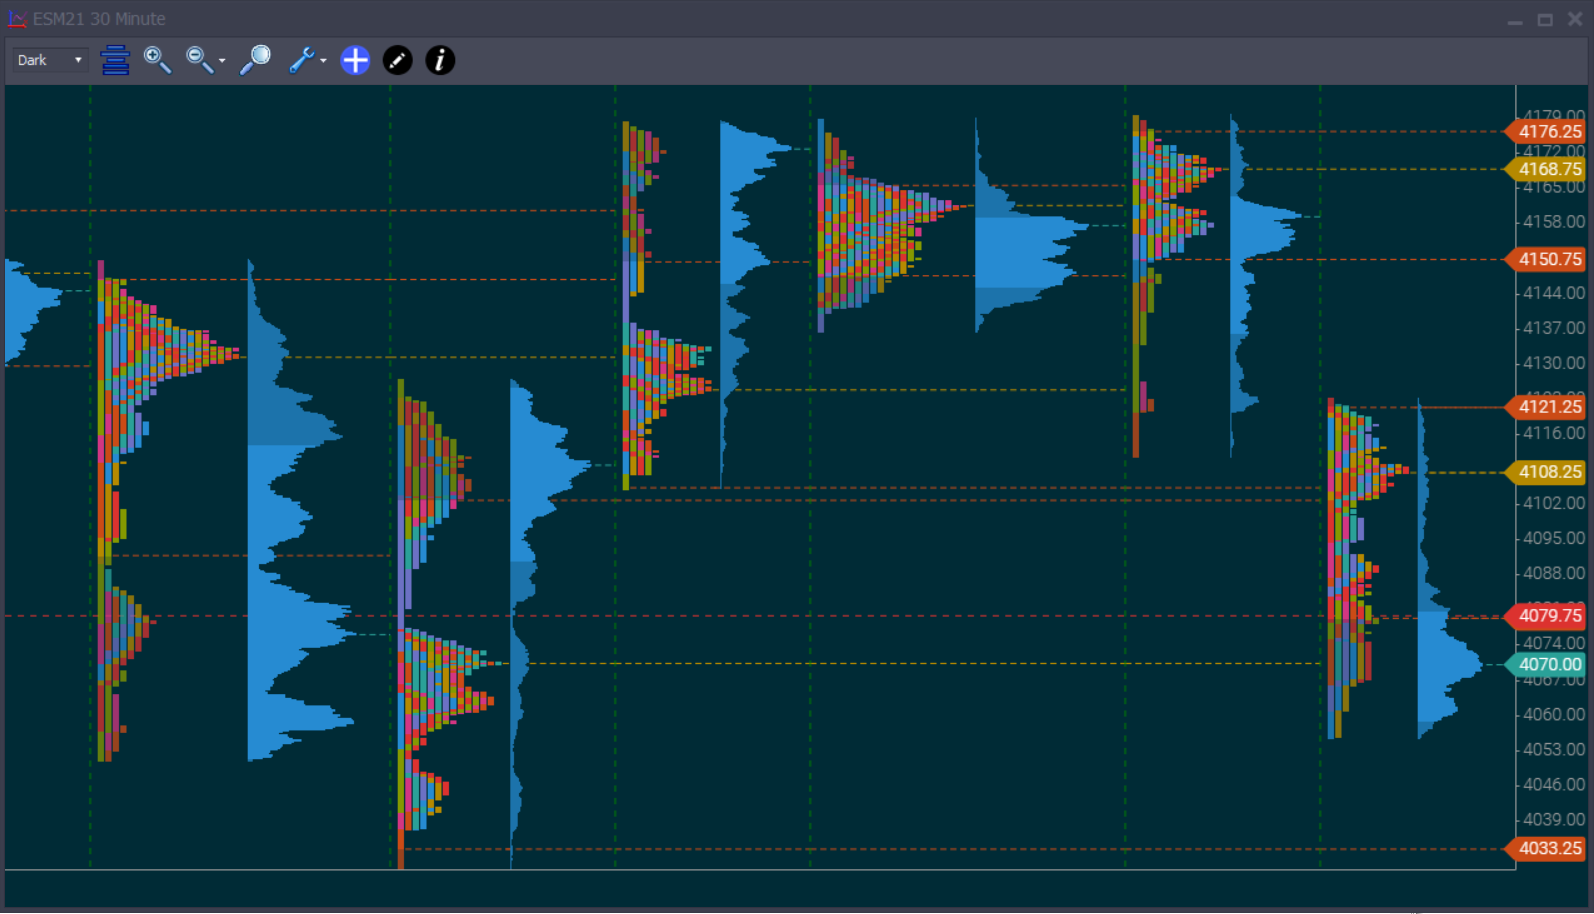
To the right of the Market Profile chart is the Volume Profile, which is a histogram showing the volume at each price within the profile.
The default timeframe for a Market Profile chart is 30 minutes. This is pretty much an industry standard and we would suggest you stick to that.
Settings are as follows:
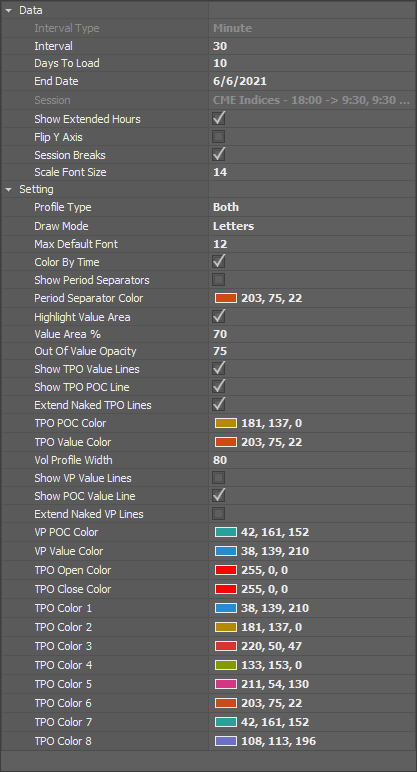
Profile Type: TPO - Show TPO bars, Volume - Show Volume Profile, Both - Show Both
Draw Mode - Letters - Show the A,B,C lettering at each TPO period (basically a new letter every 30 mins), Boxes - Show blocks instead of Letters
Max Default Font - Maximum font that can be used to paint letters
Color By Time - Check if you would like each TPO period to be painted a different color.
Show Period Seperators - Not currently used
Period Seperator Color - Not currently used
Highlight Value Area - Highlight the value area of both TPO and Volume Profile
Value Area % - Percent of Trade to build value area around
Out of Value Opacity - The value area highlight is done by making part of it more opaque. This tells us the opacity of the "out of value" part of the profile
Show TPO Value Lines - Paint a horizontal line from TPO Value which extends until another profile overwrites it
Show POC Value Lines - Paint a horizontal line from Volume Value which extends until another profile overwrites it
Extend Naked VP Lines - Not currently used