The Swing Charts details the number of contracts traded since the last major leg up or leg down. The color coding also assist in identifying if a move is a pullback or a reversal based on the volume of contracts traded based on the last move.
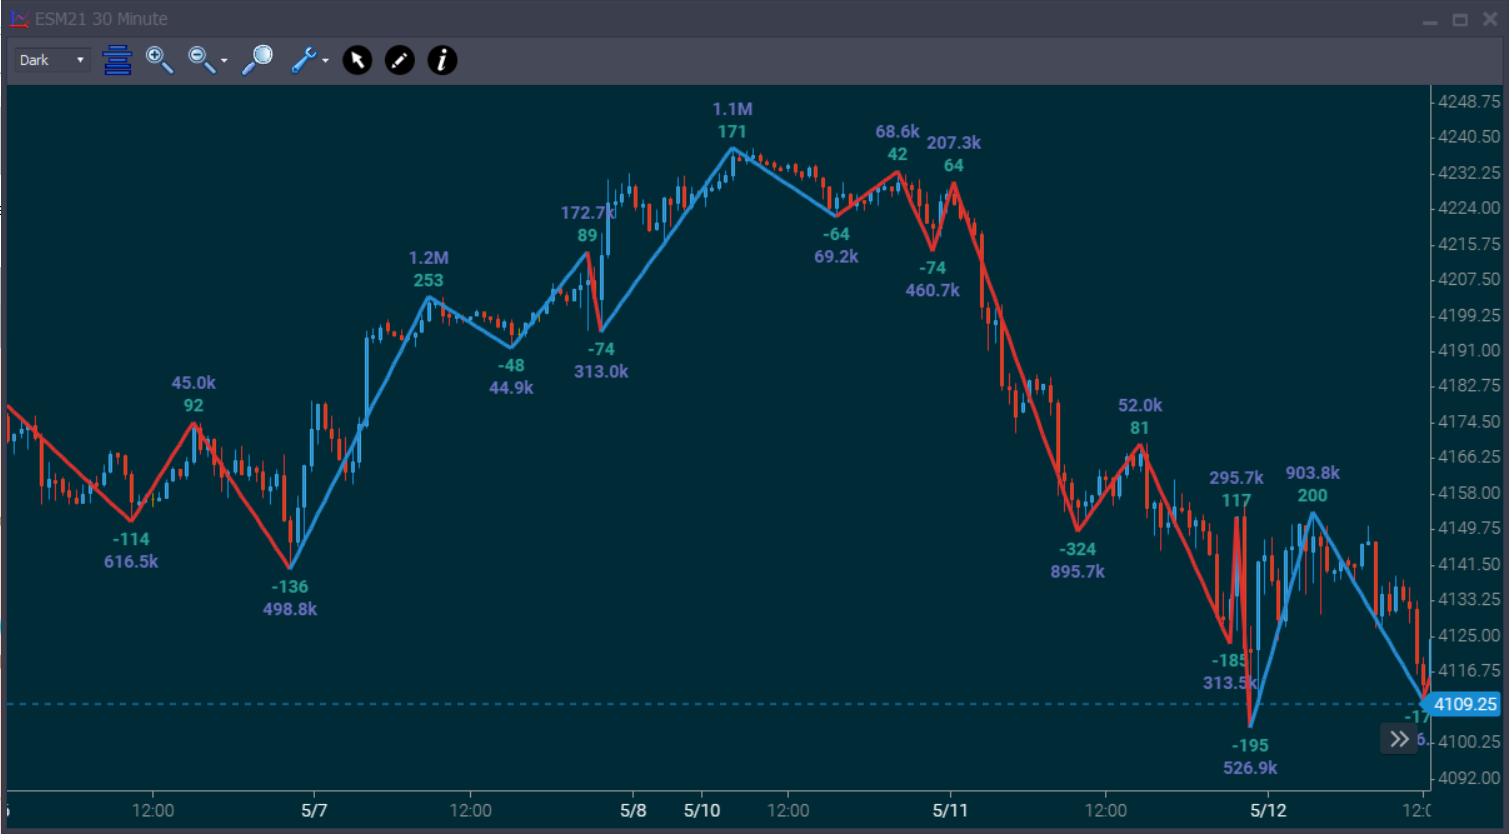
Blue Lines
- An upswing where the volume in the upswing is greater than the last downswing
- A downswing where the volume in the downswing is less than the last upswing
Red Lines
- An downswing where the volume in the downswing is greater than the last upswing
- A upswing where the volume in the upswing is less than the last downswing
Inner Numbers - the green numbers - The number of ticks in the move
Outer Numbers - the purple numbers - The number of contracts traded in the move
Settings
This study uses the "Parabolic SAR" forumulae to determine where the lines are drawn. SAR Refers to "Stop And Reverse" point. The initial SAR (stop and reverse point) is set at the end of the previous trend. For new rising trend, to calculate the next SAR, the acceleration factor is multiplied by the difference between the current high for the new trend and the prior period’s SAR. This is then added to the prior period’s SAR.
After the initial SAR is set, the next interval’s SAR is adjusted in the direction of the trend by the distance between the high for the new trend and the previous SAR then multiplied by an acceleration factor. The acceleration factor typically starts at .02 and increases by .02 to a typical maximum of .20 each period the market makes a new high/low for the move. For a rising trend:
•Previous SAR: The SAR value for the previous period.
•Extreme Point (EP): The highest high of the current uptrend.
•Acceleration Factor (AF): Starting at .02
Current SAR = Previous SAR + Previous AF(Previous EP – Previous SAR)
When price moves through the SAR point, the entire calculation starts over but the extreme point becomes the lowest low of the new trend and the AF becomes a negative number.
Current SAR = Previous SAR – Previous AF(Previous EP – Previous SAR)
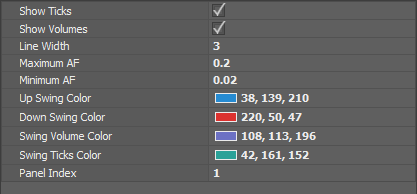
Show Ticks - Check if you want to see number of ticks in each swing
Show Volumes - Check if you want to show volume in each swing
Line Width - width in pixels for each line
Maximum AF - Maximum Acceleration Factor (see above)
Minimum AF - Minimum Acceleration Factor (see above)