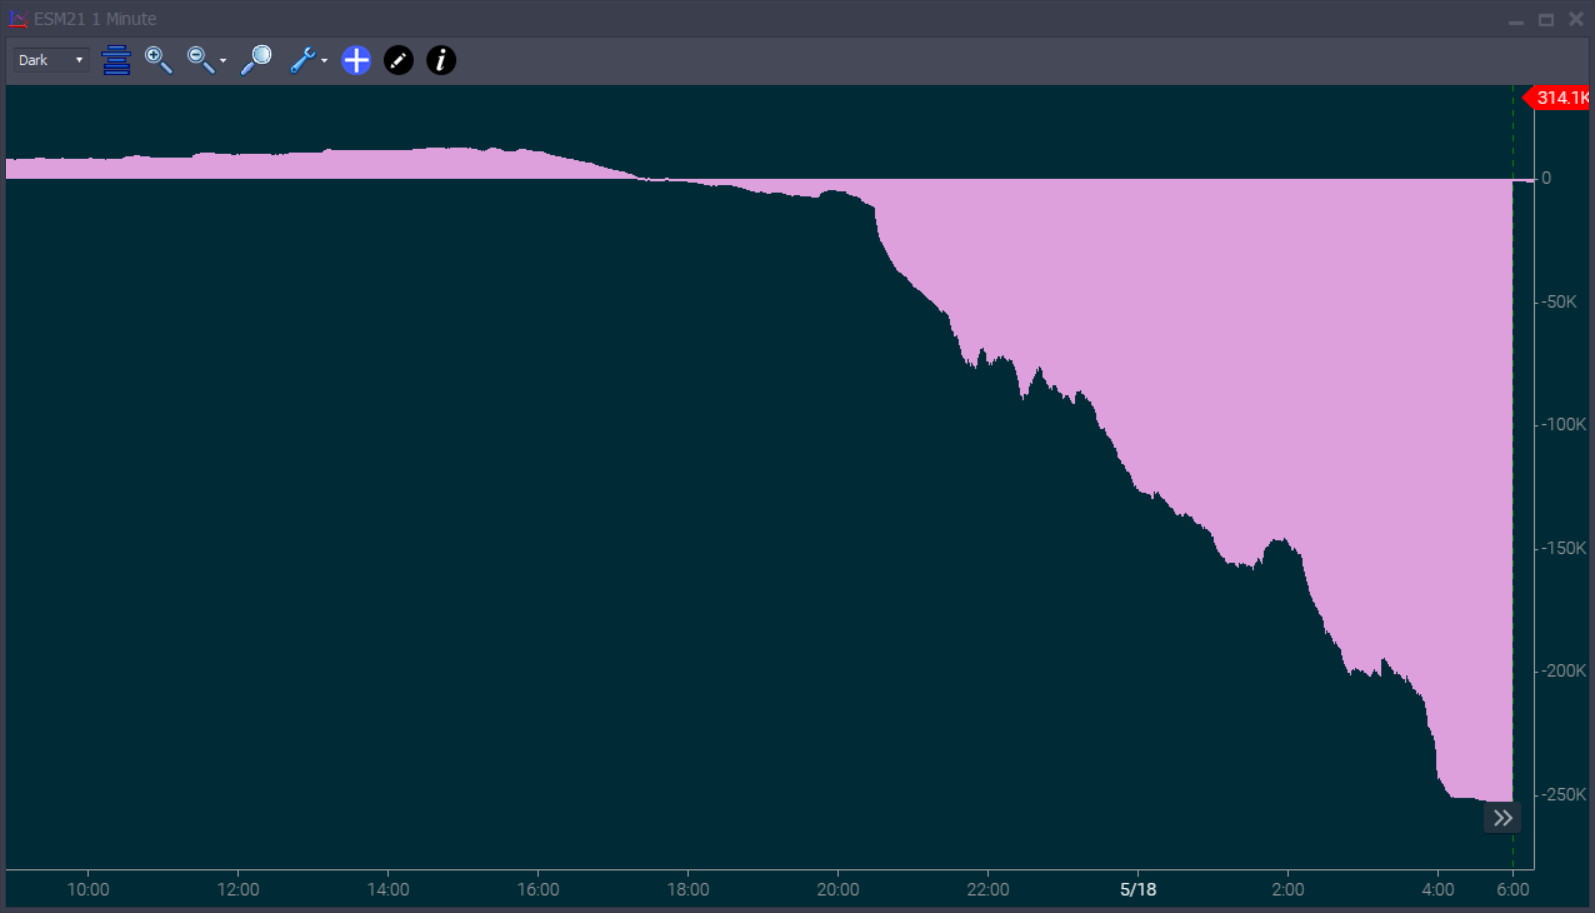
The CSI (Cumulative Sheep Index) aka Relative Volume shows the relative accumulated volume for each minute. So if it's sloping down, volume is drying up relative to the time of day. If it's sloping up, then volume is picking up. Regardless of whether we are above or below average, if it is flat, it means volume has reverted to normal.
The key here is that the absolute reading is nor important. What's important is the slope. If it's sloping down, volume is drying up. If it's sloping up, volume is swinging up - again - all relative to what we'd normally be trading this time of day.
So - are we seeing more sheep following the herd or not? My take is - if we are sloping up, chance of follow through is high. If it's sloping down, there's a good chance of reverting to range.
For more - read this blog post.
We recommend the default settings for CSI
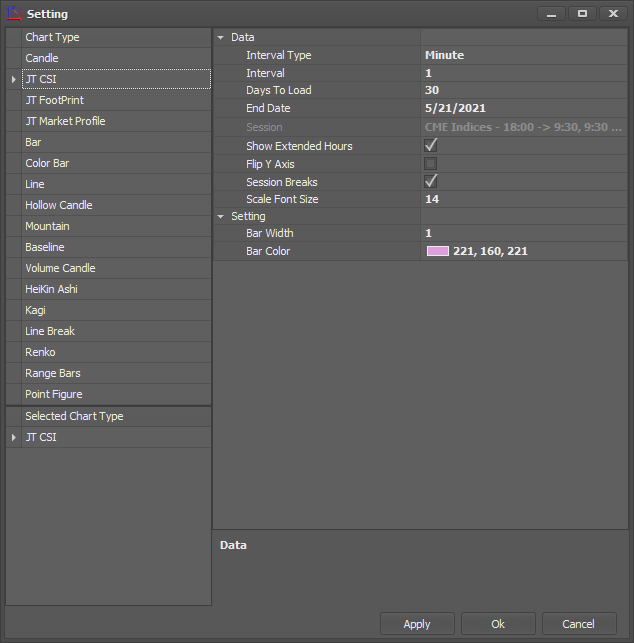
As you can see, the settings are the same as for a candlestick chart with the exception of the last 2, seeing width and colors.