The Reversal FootPrint chart combines the advantages of traditional Point and Figure charts and FootPrint charts. It takes the best of both.
Each column in a traditional P&F chart is made up of X's or O's (boxes) stacked on top of each other. The X's show how much the price has gone up, while the O's show how much it has gone down. Every X or O represents a fixed amount of price change.
The Reversal FootPrint chart will show you the volume traded on the buy and sell side for each "box".
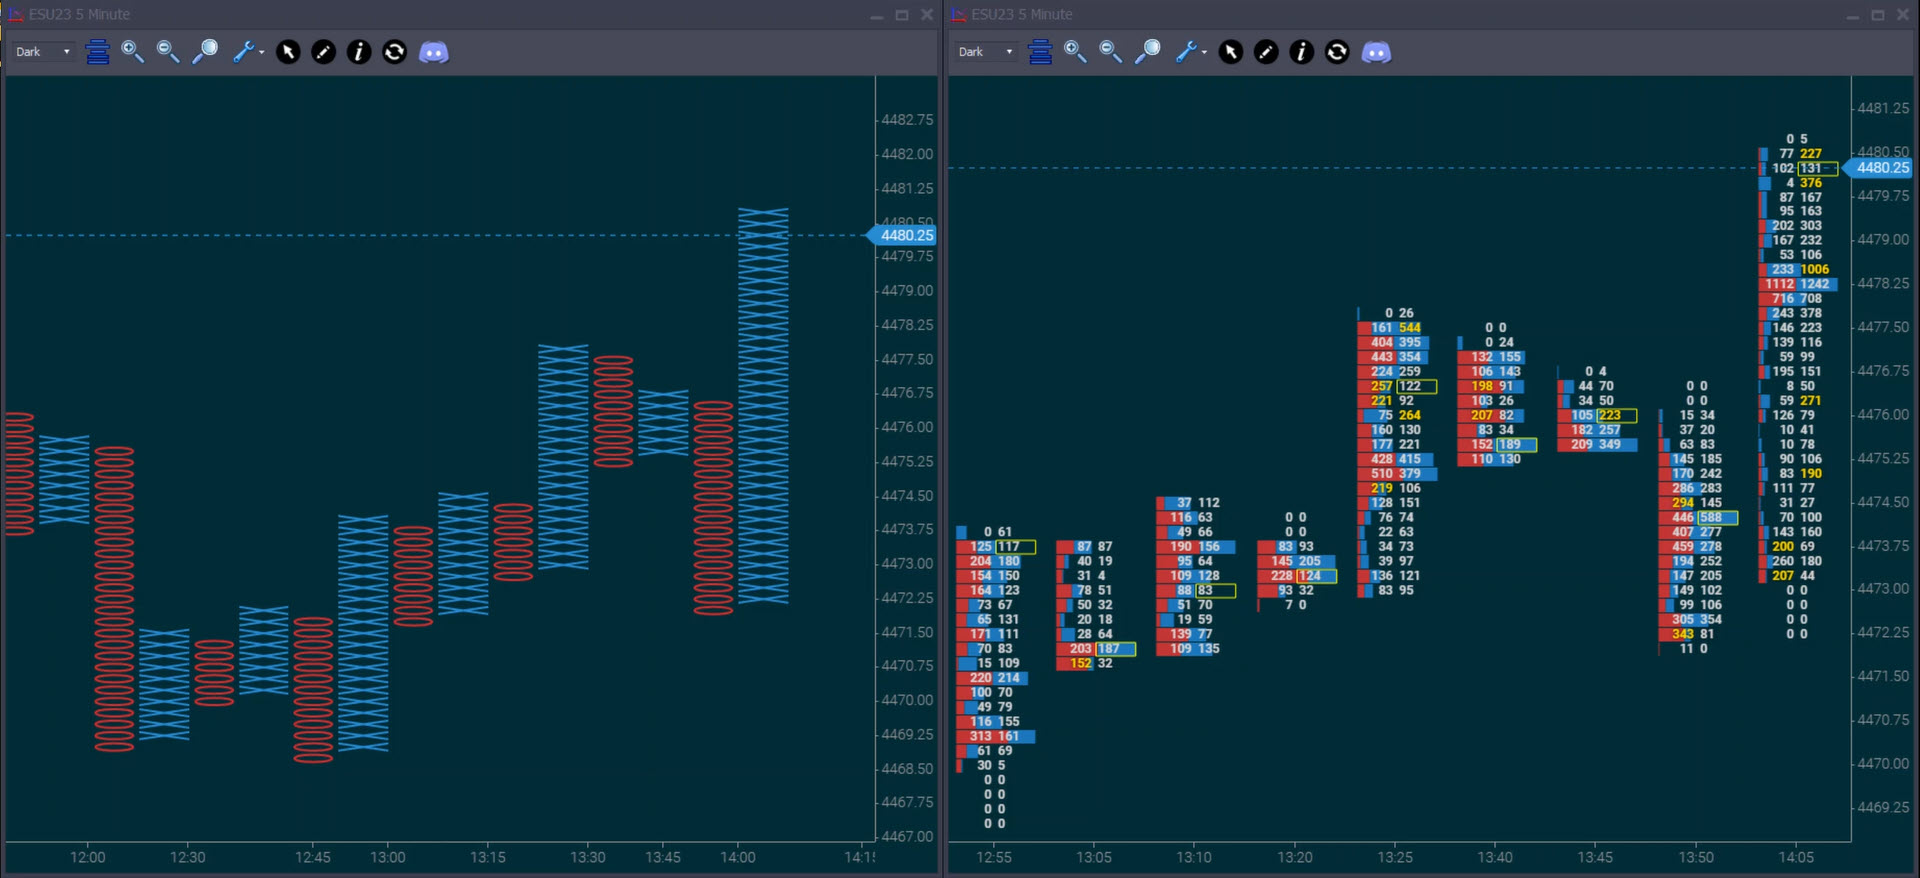
In some FootPrint columns, as you can see on the picture above, we have boxes that have 0 x 0 in them. These boxes represent the number of boxes in the P&F chart.
When the price reverses and a new column begins, the gap between the reversal point and the high or low of the previous column is filled by the 0 x 0 boxes or the O's or X's in the P&F chart.
Here's a video where you can learn more about FootPrint Reversal Charts:
Footprint options are as follows:
You can set the Interval Type of the Reversal FootPrint Chart to Tick or Minute. When you select Tick, the Interval will be automatically set to 1.
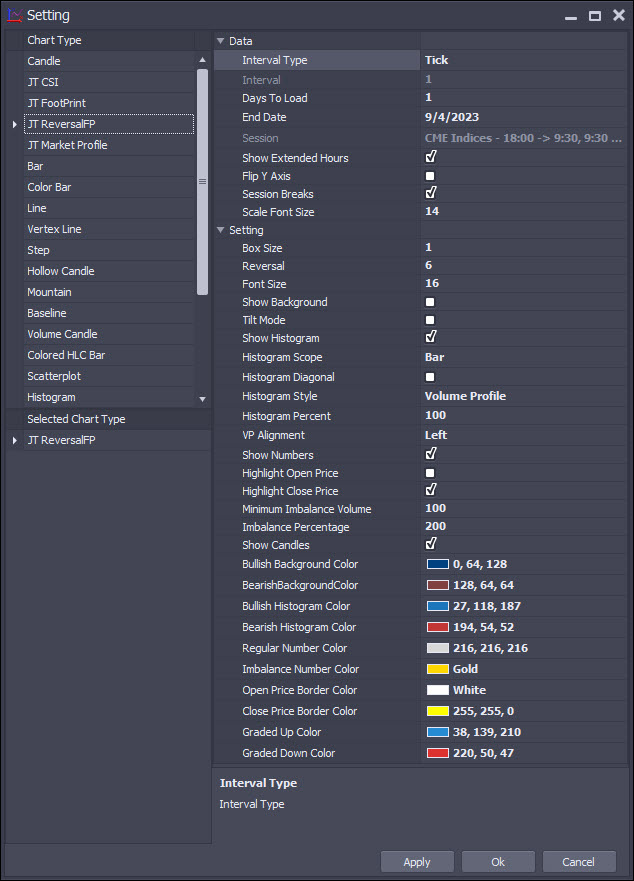
Box Size - Box size, in ticks
Reversal - Reversal amount, in ticks
Font Size - Font size to use for numbers on the footprint
Show Background - check if you want the entire background painted for contrast
Tilt Mode - Switches between tilted, non-tilted mode
Show Histogram - Paints a histogram on the Footprint background to highlight relative size traded
Histogram Scope - Bar - The histograms will be painted with size representing relative size for that 'bar', Visible - The histograms will be painted relative to the size of all visible bars
Histogram Diagonal - The histogram on the buy side will be compared to the sell above (not required to set for tilt mode)
Histogram Style - Delta - The histogram will be painted on highest side only and represent buy qty minus sell qty. Volume Profile - The histogram will be a volume profile (with red/blue color to indicate balance of trade). Volume Basic - A histogram for sells on the left of the bar, a histogram for buys on the right. Volume Profile Graded - The histogram will be a color graded volume profile (with red for down bars and blue to up bars as default)
Histogram Percent - The amount of the bar that the histogram can use.
VP Alignment - For volume profiles - whether they should be left or right aligned.
Show Numbers - Use to switch off the numbers on the profile, leaving the histograms only
Highlight Open Price - Put a (white) box around the open price of each bar
Highlight Close Price - Put a (yellow) box around the close price of each bar
Minimum Imbalance Volume - Minimum Volume that must trade at a price in order for us to consider highlighting an imbalance
Imbalance Percentage - Percentage one side must exceed the other in order for us to highlight an imbalance
Show Candles - Not currently used