Summary Tape can be launched by clicking the  icon on the daytradr desktop. The Instrument Search Window will then pop up to allow you to select the instrument you want to display. Note that at any time if you want to change instruments, just click in the main Summary Tape window and start typing. The Instrument Search Window will then appear allowing you to select a different instrument.
The Summary Tape shows the current inside bid and inside ask at the top of the screen. It also shows the number of contracts/shares traded at those levels.
On the right hand side is a running total of “Market Buy Orders minus Market Sell Orders”. This total is set to zero at:
oStart of a new session
oOpening a new Reconstructed Tape window
oRe-starting Ninja Trader
oClicking on the chart the Summary Tape is attached to and hitting F5.
This delta column should therefore be considered the “delta since I opened the window” and not “delta since the market opened”.
The Summary Tape communicates with Ninja Trader via an Indicator. To open a new Summary Tape window, simply follow the same process you would with a regular indicator.
When price moves out of an inside bid/ask area and into a new one, it will ‘print’ a new line. This line will by default be green if we ticked up out of the area and red if we ticked down out of the area.
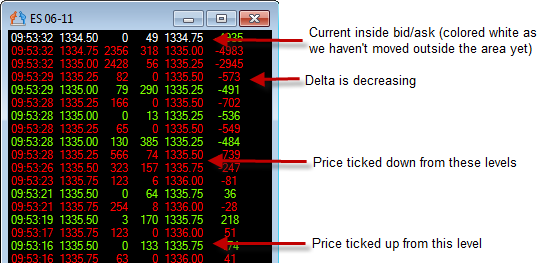
The delta line will by default be green if delta has increased since the last summary tape line and red if it has decreased since the last summary tape line.
The current inside bid/ask is always colored white as we are still in that area. The delta for the current inside bid/ask will be colored as we can identify that it is higher/lower than at the prior bid/ask level.
The summary tape will scroll down when we move outside the current inside bid/ask. It does allow for the spread to widen without scrolling down. If the ask moves up or the bid moves down, we won’t create a new row. It is only if the bid moves up and a trade occurs or the ask moves down and a trade occurs that we will create a new row. This makes little difference on a liquid instrument but does prevent a lot of unnecessary rows being generated on less liquid instruments and stocks with large prices and spreads such as Apple.
The Reconstructed Tape toolstrip looks like this: ![]()
From left to right, the options are
-Open Jigsaw Chat (see Jigsaw Chat section of this manual)
-Launch Settings Window
On launching the Settings window, the following pane will appear:
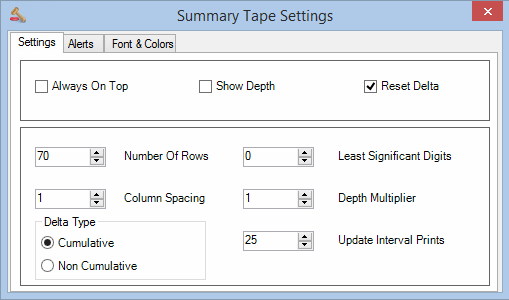
Always on Top
Set to True to ensure the windows stays on top of all other windows.
Show Depth
Set to True if you want to show the depth for the inside bid/offer on each line.
Reset Delta
Set to “True” to reset the Summary Tape, including the Cumulative Delta, at the start of each new session.
Number of rows
Sets the number of rows on the output display.
Least Significant Digits
This feature allows you to truncate the most significant part of the price. This enables you to focus on the parts of the price that change. For example:
-If Least Significant Digits was set to 4 and had a price of 1348.70 on the e-mini S&P Futures, it would be displayed as 48.70.
-If Least Significant Digits was set to 3 and had a price of 1.4819 on the Eurodollar Futures, it would be displayed as 819.
This saves space but more importantly saves you from having to mentally ignore the unchanging portion and focus on what matters. It makes the tape a lot easier to read.
Note that a setting of zero will prevent any reformatting of price.
Column Spacing
Sets the number of spaces between each column. Default is 1 space.
Depth Multiplier (eSignal data users)
The eSignal feed, it gives depth info in lots of 100 for stocks but reports trades in actual quantity. This messes with the calculations for the alerts. Do not change this unless you are an eSignal user trading stocks. If you use eSignal, set this to 100.
Delta Type
Sets the type of delta to be displayed. Setting the Delta Type to “Cumulative” will cause each summary tape row will show its own delta (market buys minus market sells) plus the delta of all other lines below it. If the Delta Type is set to “NonCumulative”, then each row will show its own delta only.
Update Interval Prints
Maximum number of prints to display in any 250ms interval. Setting to “0” will push all prints to the screen as they come in. This is to prevent slowdowns in fast markets. A setting of “25” appears to be the sweet spot. Setting too low (e.g. 10) will give you a “jerky” tape that doesn’t flow well. Setting above 25 does not appear visually different but can consume additional processor clock cycles.