POT Gauge gives a unique at a glance view of market participation relative to recent historical averages. This is an excellent tool to see (for example) if traders are aggressively trading into a breakout level or if traders are stepping off the gas and not participating. The gauge can be launched by clicking the  icon on the daytradr desktop. The Instrument Search Window will then pop up to allow you to select the instrument you want to display.
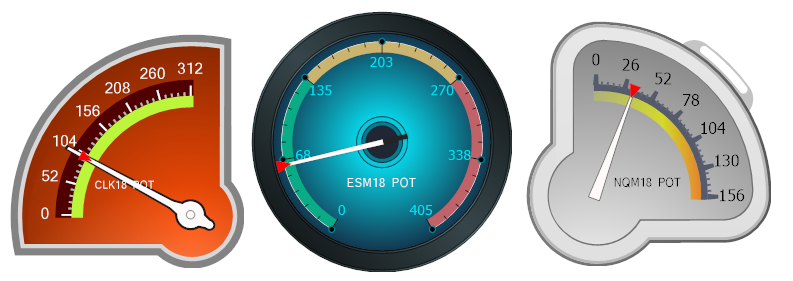
There scale on the gauge is set based on recent trading activity for that market.
The needle is the activity right now.
The red "marker" shows the highest value the needle has been at since the scale last reset.
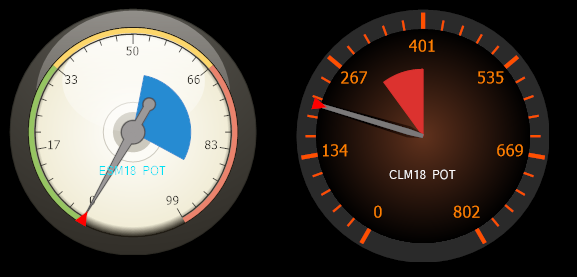
The inner blue/red shaded area above is balance of trade. Total buy market orders minus sell market orders for the period. Red means an imbalance to the sell side, Blue an imbalance to the buy side.
The imbalance section can cover up to 50% of the gauge area. If it is 50% blue then that means all of the trade was buying.
Manipulating the Gauge
Left click and hold the mouse on the Gauge, to move the gauge to a new location.
Right click the gauge to make the window border visible, to allow for resizing.
Click the ![]() icon to launch the search window to search for a different feed/instrument.
icon to launch the search window to search for a different feed/instrument.
Click the![]() icon to reset the meter marker to the current needle position
icon to reset the meter marker to the current needle position
POT Gauge Settings
To get to the parameter settings window, click the toolkit icon ![]() that appears when you float the mouse over the gauge.
that appears when you float the mouse over the gauge.
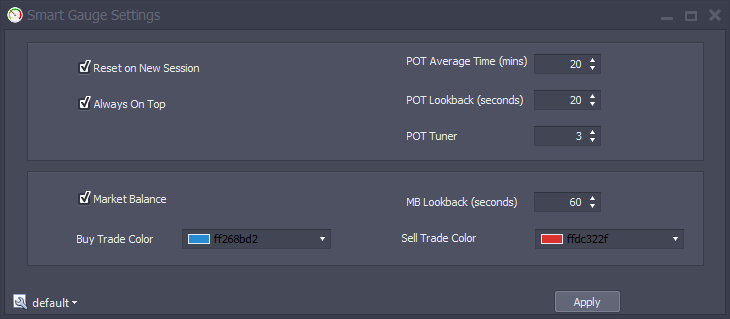
Reset on New Session - reserved for future use.
Always on Top - Make this window on top of other windows (default is on)
POT Average Time - The amount of time in minutes to lookback when calculating what is normal, low and excessive trade activity. Used to set the scale. 20 minutes is the default and from our testing looks to be an appropriate setting
POT Lookback - The amount of time in seconds to lookback when calculating the needle position. Again, 20 seconds worked really well in our testing
POT Tuner - While the tools are self tuning, some markets are outliers (like DAX) - on these markets, you might spend an excessive amount of time in the red zone. If you see that, set the POT Tuner up to make it LESS Sensitive.
Market Balance - Enable market balance indicator
Market Balance Lookback (Seconds) - Rolling number of seconds the Market Balance looks back
Buy Trade Color - Color to shade a buy side imbalance
Sell Trade Color - Color to shade a sell side imbalance
If you change any of these 3 settings, click "Apply" to ensure the system recalibrate's the gauge.
Gauge Style Selector
Click the smaller icon on the gauge itself, to open the gauge style selector. Note that this is a modal window and that means other windows in the application will not respond to the mouse when this is open. We try to avoid this as much as possible at Jigsaw but this is a 3rd party window, so we have to live with it.
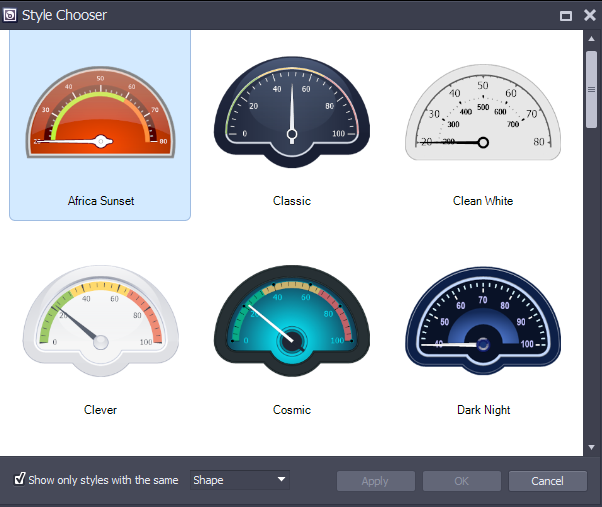
You can select gauges with the same shape or with the same style.