The Centre columns shows the number of contracts traded against the inside bid and ask “This time around”. Note that these columns can be cleared in a number of different ways. We have 6 icons that handle clearing these columns:
![]()
Dustbin Icon (F3) – clears the Current Trades column for all prices (also clears the split volume profile). Left click performs the operation for this window, Right click performs it for all open Depth & Sales windows. Also clears the power meter if “Reset on Clear Current Trades” is set.
First Up Arrow Icon – clears the split volume profile for all prices above the inside ask. This is useful after a move down. As we move back up, we can clear the current trades columns to make the move up easier to read. Left click performs the operation for this window, Right click performs it for all open Depth & Sales windows.
First Down Arrow Icon - clears the split volume profile colum for all prices below the inside bid. This is useful after a move up. As we move back down, we can clear the current trades columns to make the move down easier to read. Left click performs the operation for this window, Right click performs it for all open Depth & Sales windows.
Brush Icon (F4) – clears the Current Trades column for all prices (does not clears the split volume profile). Left click performs the operation for this window, Right click performs it for all open Depth & Sales windows. Also clears the power meter if “Reset on Clear Current Trades” is set.
Second Up Arrow Icon (F5) – clears Current Trades colum for all prices above the inside ask. This is useful after a move down. As we move back up, we can clear the current trades columns to make the move up easier to read. Left click performs the operation for this window, Right click performs it for all open Depth & Sales windows.
Second Down Arrow Icon (F6)– clears Current Trades colum for all prices below the inside bid. This is useful after a move up. As we move back down, we can clear the current trades columns to make the move down easier to read. Left click performs the operation for this window, Right click performs it for all open Depth & Sales windows.
In this example we can see 295 contracts have traded at 2073 and 0 contracts have traded at 2073.25. When this 2073/2073.25 became the inside bid/offer, we reset the number of trades here and started to accumulate them again. So, if we leave a price and come back to it, the qty of contracts in these columns is reset.
There is an exception to this. If we leave a price for a short period of time and come back to it, then we do not clear the traded quantities. By default that ‘short period of time’ is set to 2500 milliseconds (2.5 seconds).
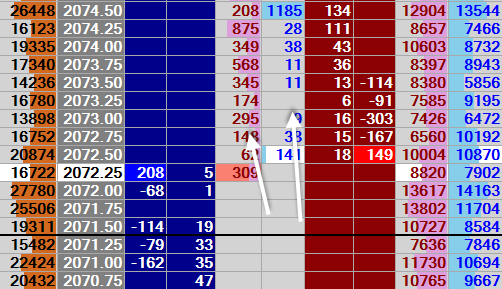
The idea is that we show the number of contracts to push through the level but it often leaves a level for just a short amount of time and comes back to it. In that case, we don’t consider it to have really left. In the above example, we can see that we had 349 contracts hit the bid at 2074 before it ticked down, we then saw 568 contracts hit the bid at at 2073.75 before it ticked down once more and then 345 contracts at 2073.50 before it ticked down again. In this time there was very little buying at market. This market is fairly weak, so it’s no surpise we carried on down. Here is the picture a few minutes later:
The inside bid and inside offer are white background by default. The light red background on the ‘309’ at 2072.25 indicates that this was the last traded price.
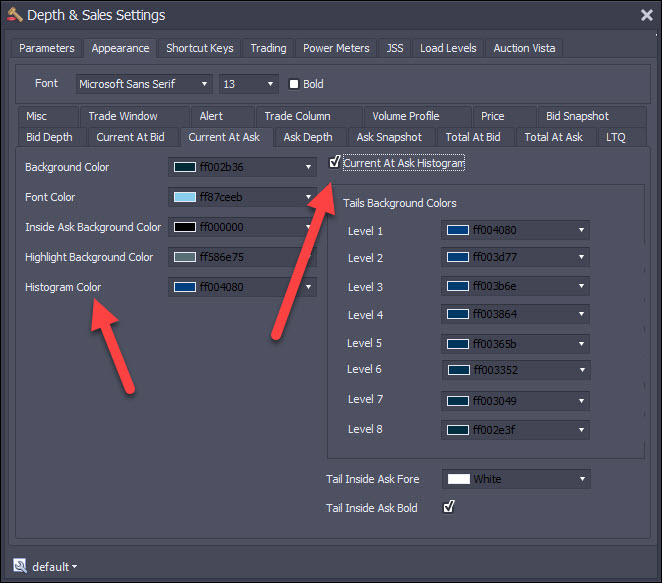
We can also see histograms bars as background color on the numbers. A Sky Blue for buy market and a Plum color for sell market. This is so that we can easily ‘eyeball’ where the largest volume traded recently. These histograms are optional.
We can also see histograms bars as background color on the numbers. A Sky Blue for buy market and a Plum color for sell market. This is so that we can easily ‘eyeball’ where the largest volume traded recently. These histograms are optional.
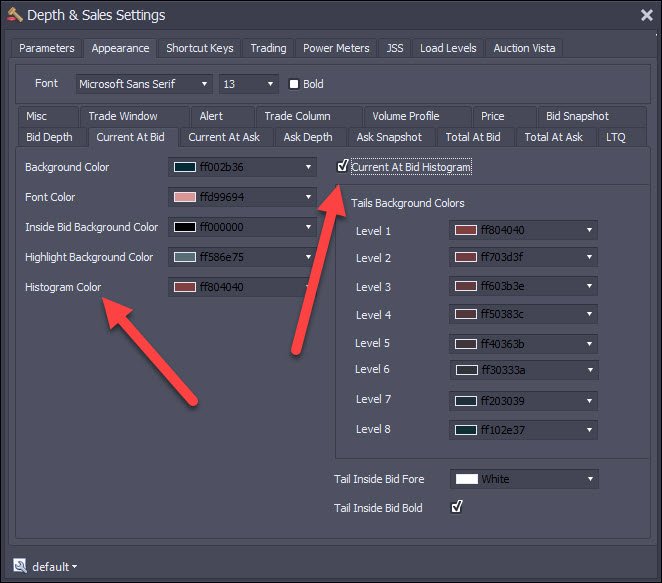
You can enable the histograms and set the colors for this here (bid side)
And here (offer side)