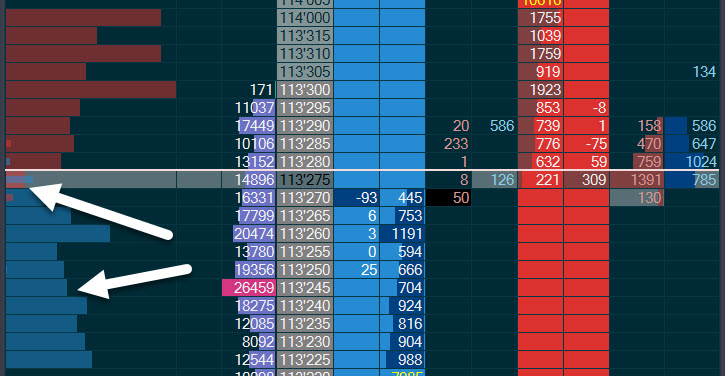
Histograms are available which show both the depth and the pulling/stacking. This is for people that are more ‘visually’ inclined.
Histograms can be enabled on the D&S Settings > Appeareance > Alert
As you can see there is a “thicker” histogram which spans the full height of the cell. There is also a smaller histogram that covers roughly a third of the cell.
The thicker histogram represents the size of the depth. In this example we have red for offers and blue for bids. The thinner histogram represents the amount added/pulled from the depth since we got to this level (same as the snapshot columns).
In the above example it is blue for adding contracts and red for pulling contracts. So we can see that they are pulling contracts from the offer and adding contrats to the bid.
These Colors can be set here:
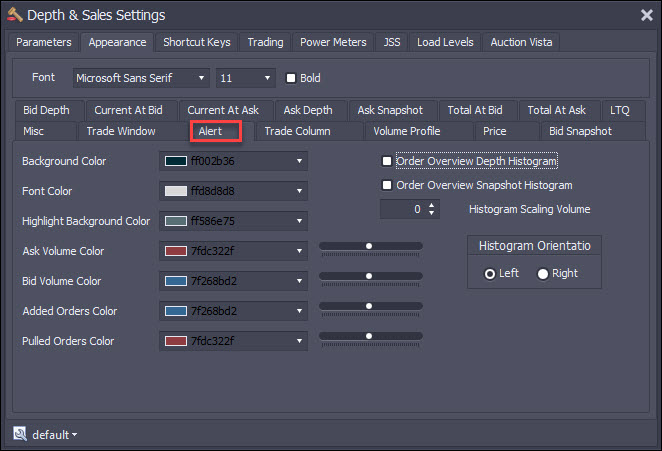
Note that the histograms may be switched on/off independently and ths histogram can be right or left justified.
As we put this in the same column as the alerts, the histogram bars are transparent. You can set the level of transparency with the sliders next to the color setting.
The histogram scaling volume will set the scaling for the histograms. If this is set to zero, then the histogram bar size will be scaled relative to the size of the largest bid/offer. If you set a value, then the histogram bars will be scaled relative to this value.
If histogram scaling is set to 1000, then a bid of 500 will take up half the width of the column. If it is set to 1000 or above, it will take up 100% of the width.